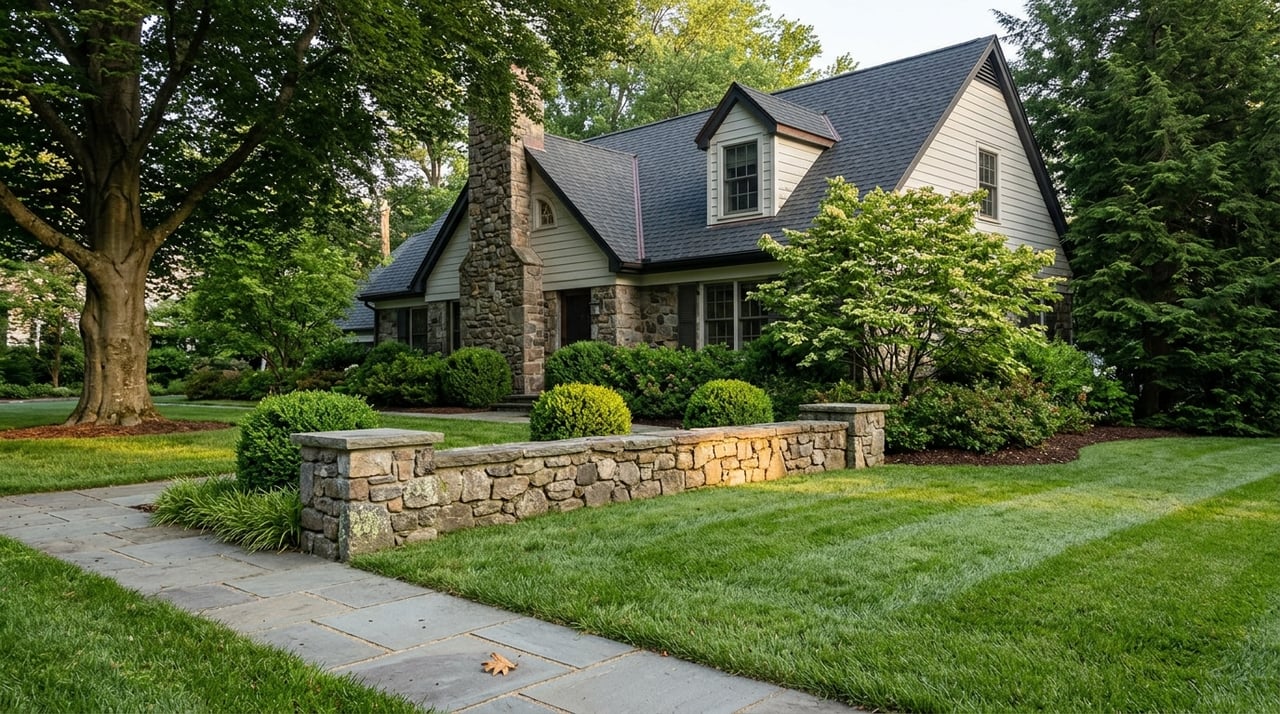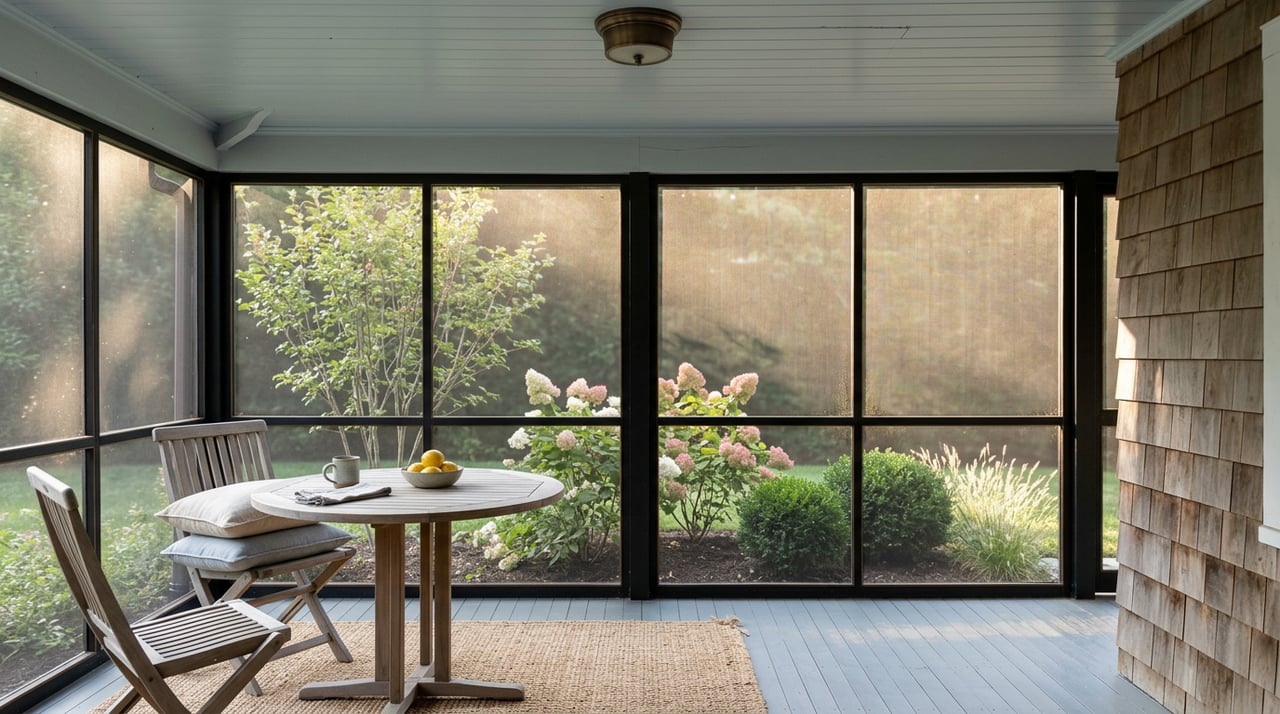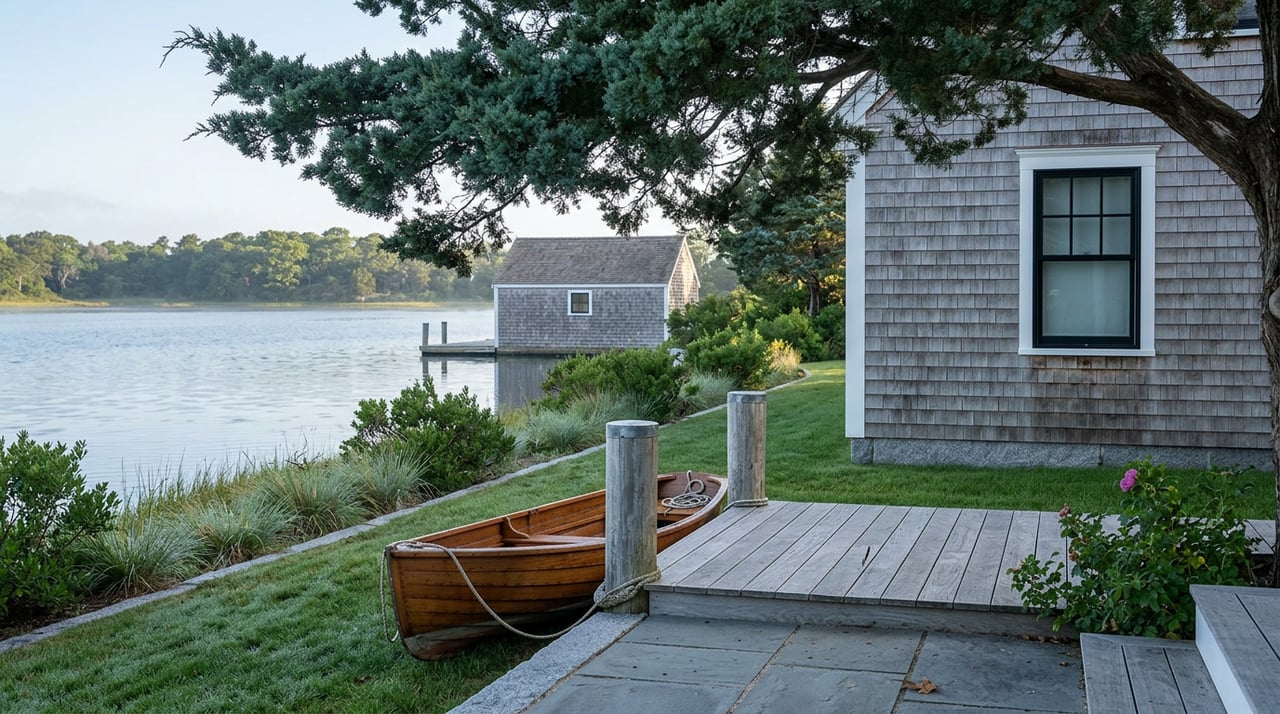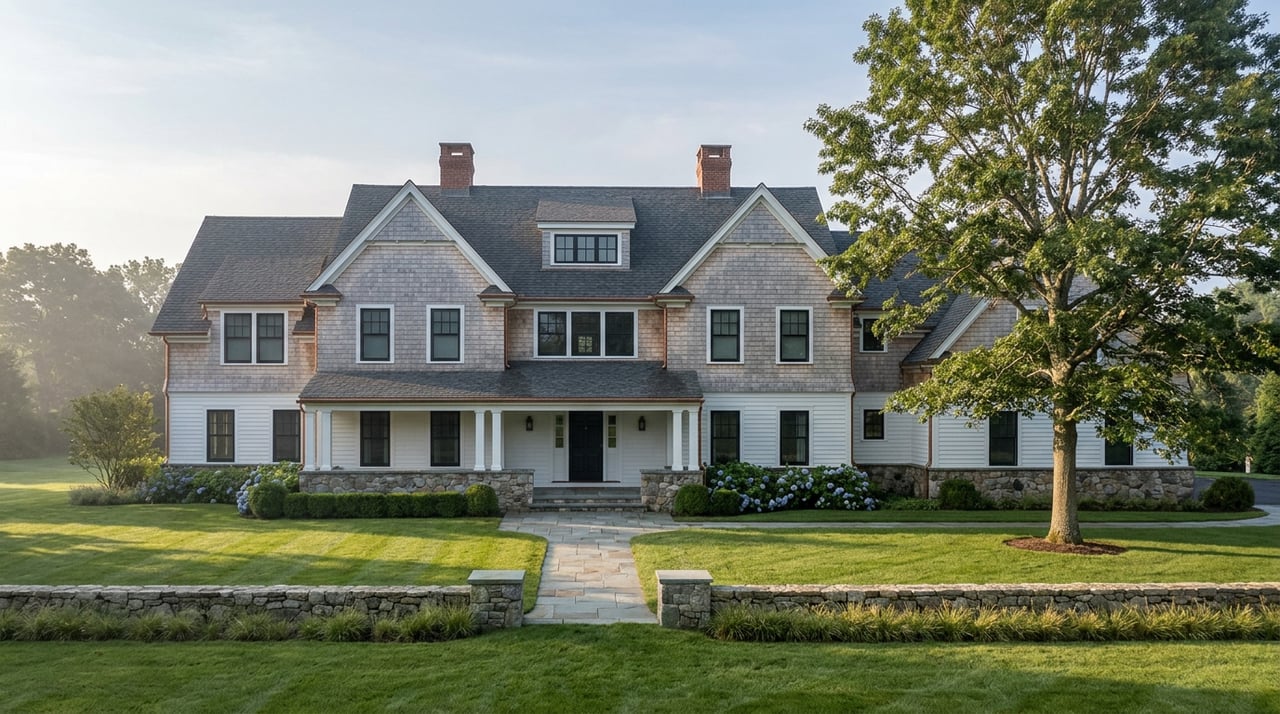
Picture two Saturday showings three miles apart. The first is a shingle-style colonial in Cos Cob, walk to the train platform, city water, city sewer, a closing file that will look like every other closing file in Fairfield County. The second sits four acres north of the Merritt Parkway in Backcountry, stone walls, a barn, and a private well and septic system that need their own inspection contingencies before anyone signs anything. Same town. Same median price quoted on every portal. Almost nothing else the same.
That gap is the whole story of Greenwich real estate in 2026. The town-wide median sale price has moved in four different directions across four consecutive reporting periods this year, and none of those moves describe what a typical buyer's budget actually needs to do. The number keeps changing because the mix of what closed keeps changing, not because Greenwich homes are worth wildly different amounts from one month to the next.
The Median That Moved Four Times This Year
The Greenwich Association of REALTORS publishes monthly and quarterly closing data pulled from the Greenwich Multiple Listing Service, and the 2026 numbers tell a jumpy story. In May 2026, the single-family median sale price rose 16.67% year over year to $3,150,000, even as closings fell 15.25% and homes sat on the market 23% longer than the year before. One month later, June's median fell 2.24% to $3,812,500, while days on market dropped 23%. Zoom out to the full second quarter, April through June, and the median climbed 15.1% to $3,655,000 on 144 closings, down 8.9% from the same quarter a year earlier. Then July's report, released in early August, showed the median up just 2.49% to $3,602,000, with days on market down 28% and new listings up 28% year over year.
Four periods, four different percentage changes, in a market where nobody is claiming home values actually rose 16% one month and fell the next. GAR President Brian Amen described the pattern plainly in the association's June release, calling it "a dynamic market in Greenwich, balancing shifting inventory levels with sustained buyer interest." The condo segment moved even harder. The condo median climbed 23.17% year over year in June to $970,000, then fell 13.1% year over year in July to $954,500, with July's days on market up 48.65% from a year earlier, stretching from 37 days to 55. A market doesn't reprice a fifth of its value and then give most of it back the following month. A market with a small number of transactions, at a wide range of price points, produces exactly this kind of noise.
Where the Swing Actually Comes From
The mechanism is composition, not appreciation or correction. Fewer or more transactions closing in a given price bracket moves the median even when nothing about underlying value has changed. Broker tracking of the first quarter of 2026, January through March, put this in sharp relief: the headline single-family median fell 19% year over year, which on its face reads like a soft quarter. But price per square foot in that same window actually rose 3.2% to $936, and the average home sold for 103.4% of its asking price, a clear sign of buyers competing rather than retreating. The median dropped because more of the quarter's closings landed in the $1 million to $3 million range, pulling the number down even as the underlying market strengthened. Within that band, the $1 million to $2 million bracket alone saw 19 closings at a sale-to-list ratio of 108.5% and just 43 days on market, the fastest-moving bracket of the quarter. Homes in the $3 million to $4 million range averaged just 8 days on market. Even the $10 million-plus tier, historically the slowest corner of the market, saw its typical time on market drop from 278 days to 176.
Fairfield County-wide data backs up why this matters more in Greenwich than almost anywhere nearby. Douglas Elliman's second-quarter Fairfield County report found that Greenwich accounts for roughly 5% of the county's single-family sales but close to 19% of its dollar volume, a gap driven by waterfront trades and backcountry estates that pull the town's average price far above its median. A single $20 million closing on the water in Belle Haven or a multi-acre estate sale off North Street can move an average in a way it would never move in Darien or Westport, where the top end of the market is thinner. Treat the town's median or average as a single line, and the line is telling you about whichever handful of high-end sales happened to close, not about what a typical buyer will pay.
Five Towns Inside One Zip Code Range
The neighborhood-level breakdown from full-year 2025 data makes the underlying structure visible. Old Greenwich and Cos Cob were the fastest-moving markets in town, both averaging under 40 days on market with sale-to-list ratios above 103%, meaning consistent overbidding. Glenville offered similar speed at a lower entry point, with a median around $1.685 million. South Parkway led all neighborhoods in total volume with 95 closings, trading close to list price rather than above it. South of Post Road, meanwhile, commanded the highest price per square foot in town. A few minutes east, Riverside south of the railroad tracks has carried a similar reputation for years; a Greenwich real estate attorney made that exact point to local press back in 2019, describing it as the corridor where well-to-do young families and downsizers alike compete hardest, a description the 2025 numbers suggest still fits the neighborhood a few streets over.
At the other end, Backcountry and North Parkway ran 105 to 120 days on market with sale-to-list ratios below 97%, meaning buyers in those neighborhoods typically closed below asking. That slower pace often comes bundled with a different transaction altogether. Multi-acre parcels north of the Merritt commonly rely on private wells and septic systems instead of municipal water and sewer, which means well-flow tests, septic inspections, and financing conversations that a buyer touring a Cos Cob colonial or an Old Greenwich cape never has to have. The Greenwich Land Trust maintains much of the conserved land that gives Backcountry its rural feel, and that same acreage is exactly why due diligence there looks nothing like due diligence three miles south.
| Neighborhood area | Typical pace | Pricing dynamic (full-year 2025) |
|---|---|---|
| Old Greenwich, Cos Cob | Under 40 days on market | Sale-to-list above 103%, consistent overbidding |
| Glenville | Comparable speed to Old Greenwich | Lower entry point, median near $1.685M |
| South Parkway | Highest closing volume (95 sales) | Trades closer to list price |
| South of Post Road | Not broken out separately | Highest price per square foot in town |
| Backcountry, North Parkway | 105 to 120 days on market | Sale-to-list below 97%, room to negotiate |
What This Means Against Darien or New Canaan
Buyers weighing Greenwich against Darien or New Canaan often start with a single median-to-median comparison, and that comparison is already shaky before it crosses a town line. Greenwich's inventory has run thin in 2026, with active single-family listings down 18.7% year over year as of July, while New Canaan's inventory runs tighter still and its days on market have historically stretched longer. Darien, at the same time, has been selling faster than almost anywhere in the county this year. None of that means one town is a better value than another. It means each town's median is compressing a different mix of housing stock, lot sizes, and price tiers into one number, and Greenwich compresses the widest range of all, from a Byram cape to a backcountry estate on multiple acres.
The Practical Takeaway for a Buyer's Budget
If you're planning a move to Greenwich, the town-wide median is a poor starting point for a budget. A better one is the neighborhood you're actually shopping in and the price bracket you expect to transact in, since both move at their own pace and their own ratio of sale price to asking price. A buyer targeting Old Greenwich or Cos Cob should expect competition and a fast timeline. A buyer looking at Backcountry acreage should expect more room to negotiate, a longer runway to close, and a due diligence process built around well and septic conditions rather than a municipal utility bill. Those are two different transactions wearing the same town name, and the median headline was never built to tell them apart.
A Few Questions Worth Asking Before You Set a Budget
Is Greenwich's median home price rising or falling in 2026? Both, depending on which month you look at. The single-family median rose in May, fell in June, rose again for the full second quarter, then rose more modestly in July. The swings say more about which price brackets closed each period than about a consistent trend in either direction.
Why do condo prices move more than single-family prices? Fewer transactions close each month in the condo segment, so a handful of higher- or lower-priced units can shift the median sharply. Greenwich condo closings jumped 57% year over year in June and 47% in July, small enough sample sizes that a few unit sales at either end of the price range can swing the reported median by double digits.
Which Greenwich neighborhood moves fastest right now? Old Greenwich and Cos Cob have consistently posted the shortest days on market and the strongest sale-to-list ratios, both trading under 40 days with homes routinely selling above asking. Backcountry and North Parkway sit at the opposite end, with more time on market and more room for a buyer to negotiate.
Greenwich rewards buyers who shop by neighborhood, not by headline. If you're comparing Greenwich against Darien, New Canaan, or another Gold Coast town and want a read on what your specific budget actually buys in each one, Beth Vaccaro can walk you through the comparison street by street. Let's Connect.